A public dispute between Donald Trump and Elon Musk dropped the bitcoin around $ 100,000, causing $ 308 million in liquidations on long positions. The king of cryptocurrencies recently exceeded $ 110,000, and yet, according to an indicator using the mobile average at 200 weeks, it is still far from overheating. Does the recorded fall call into question the dynamics of Bitcoin? We analyze the situation of the king of cryptos in the bulletin of the day!
The Bitcoin price fell 1.7 % in 24 hours
After several days of lateralization around $ 105,000the sellers managed to bring back the course of Bitcoin around the $ 100,000. From then on, the BTC 1.7 % drop in 24 hoursand near 3 % in a week ::
| Pair | 1h | 24h | 7d | 1m | 3m | 6m |
|---|---|---|---|---|---|---|
|
BTC/ETH |
0.12% | 4.43% | 3.80% | -20.74% | 4.22% | 67.21% |
|
BTC/USDT |
0.13% | -1.67% | -2.90% | 6.61% | 19.55% | 3.09% |
Bitcoin performance in the face of different pairs. Source : Coincheckup
Despite this drop, the course remains up 6.6 % in a monthand near 20 % in three months. There BTC/ETH pair goes up With the fall of Bitcoin. Indeed, the pair climbs 4.4 % in 24 hoursand 3.8 % in a week. Nevertheless, it is in drop by more than 20 % over the last month.
Bitcoin must remain beyond $ 97,000 to avoid panic of recent buyers
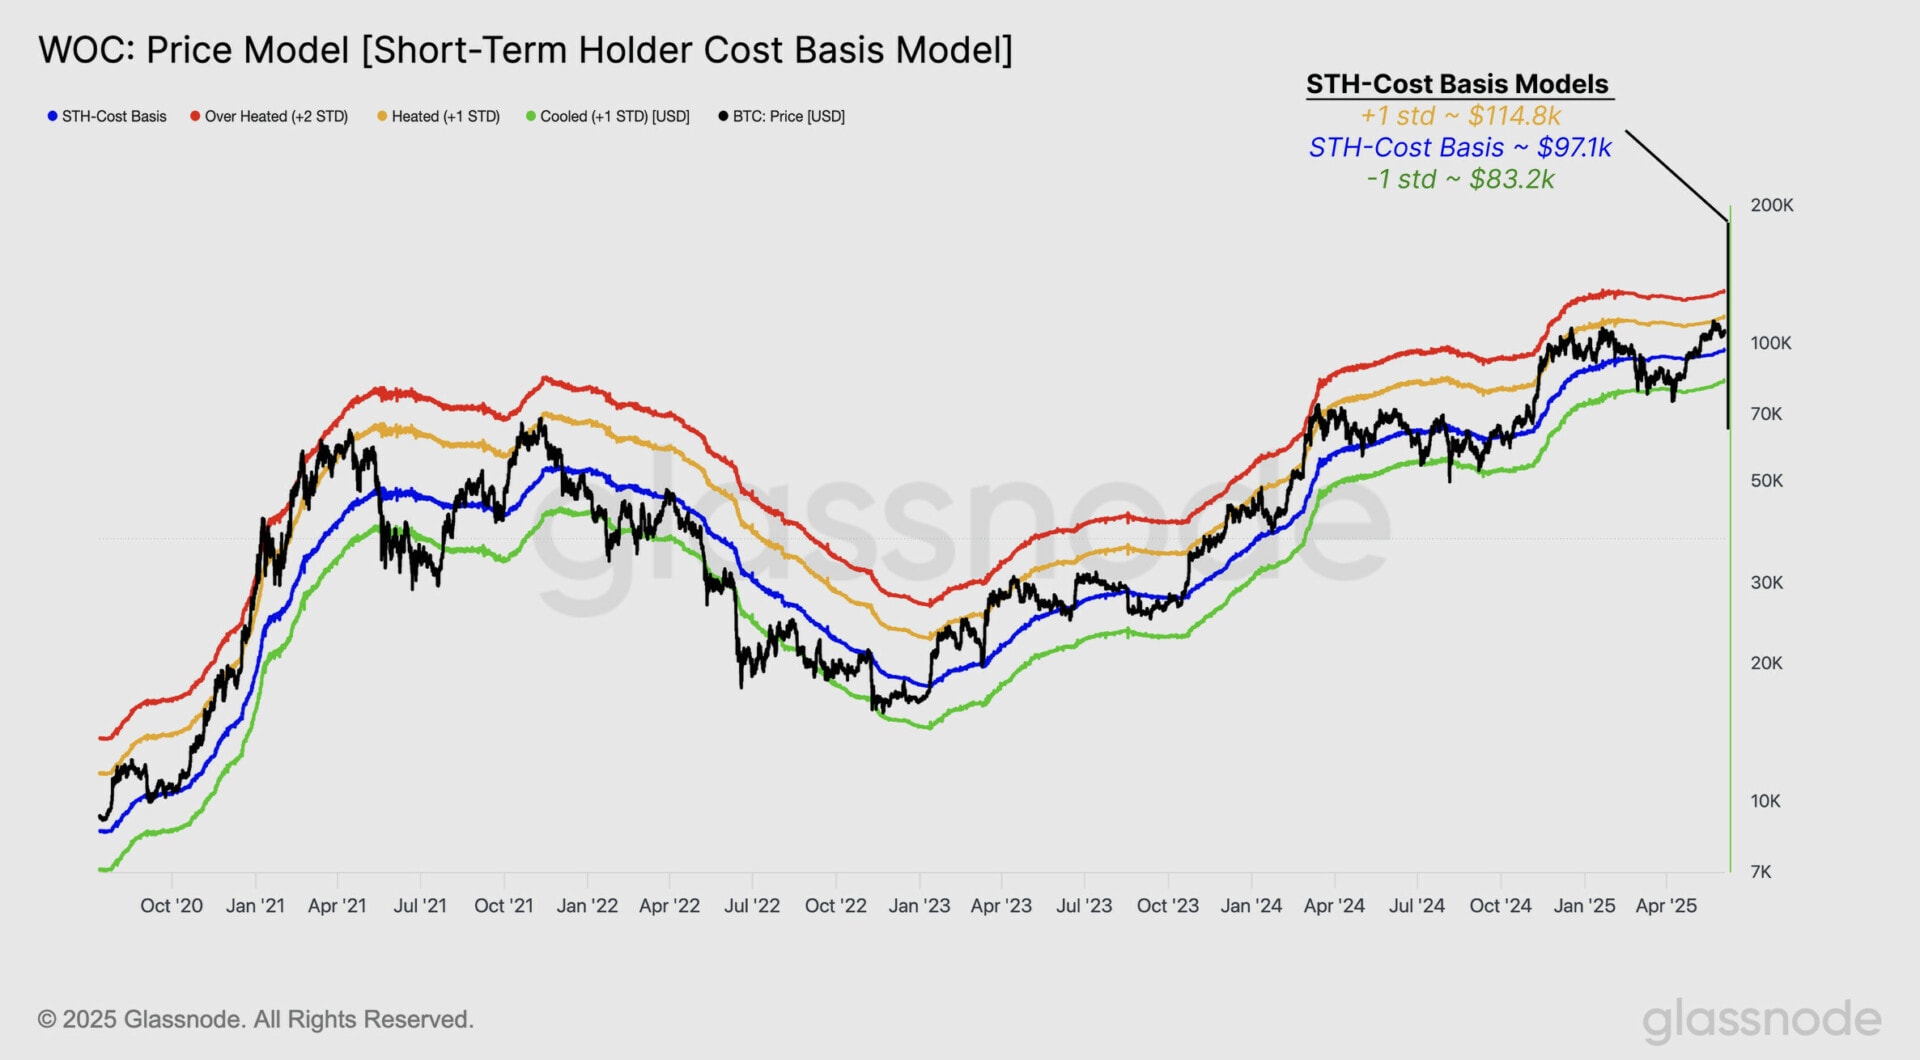
There blue curve of the indicator below corresponds to Average purchase price of short -term holders. In the weekly report of June 5, Glassnod analysts shared an indicator that stems from this metric on-chain ::


Since the start of the cycle, we notice that the BTC finds bottoms market between blue curve and green curve. Also, the BTC records tops around two upper curves (orange and red). As long as the course retains the average purchase price of short -term holders at $ 97,000he has the opportunity to continue climbing. However, a loss of this threshold on-chain could cause a violent correctionas was the case in 2024 and 2025. In fact, under the $ 97,000short -term holders could panic.
According to this indicator, a risk zone would be reached in the event of an increase in bitcoin around the Orange curve located around $ 115,000.
Back on the support at $ 102,000 for the BTC
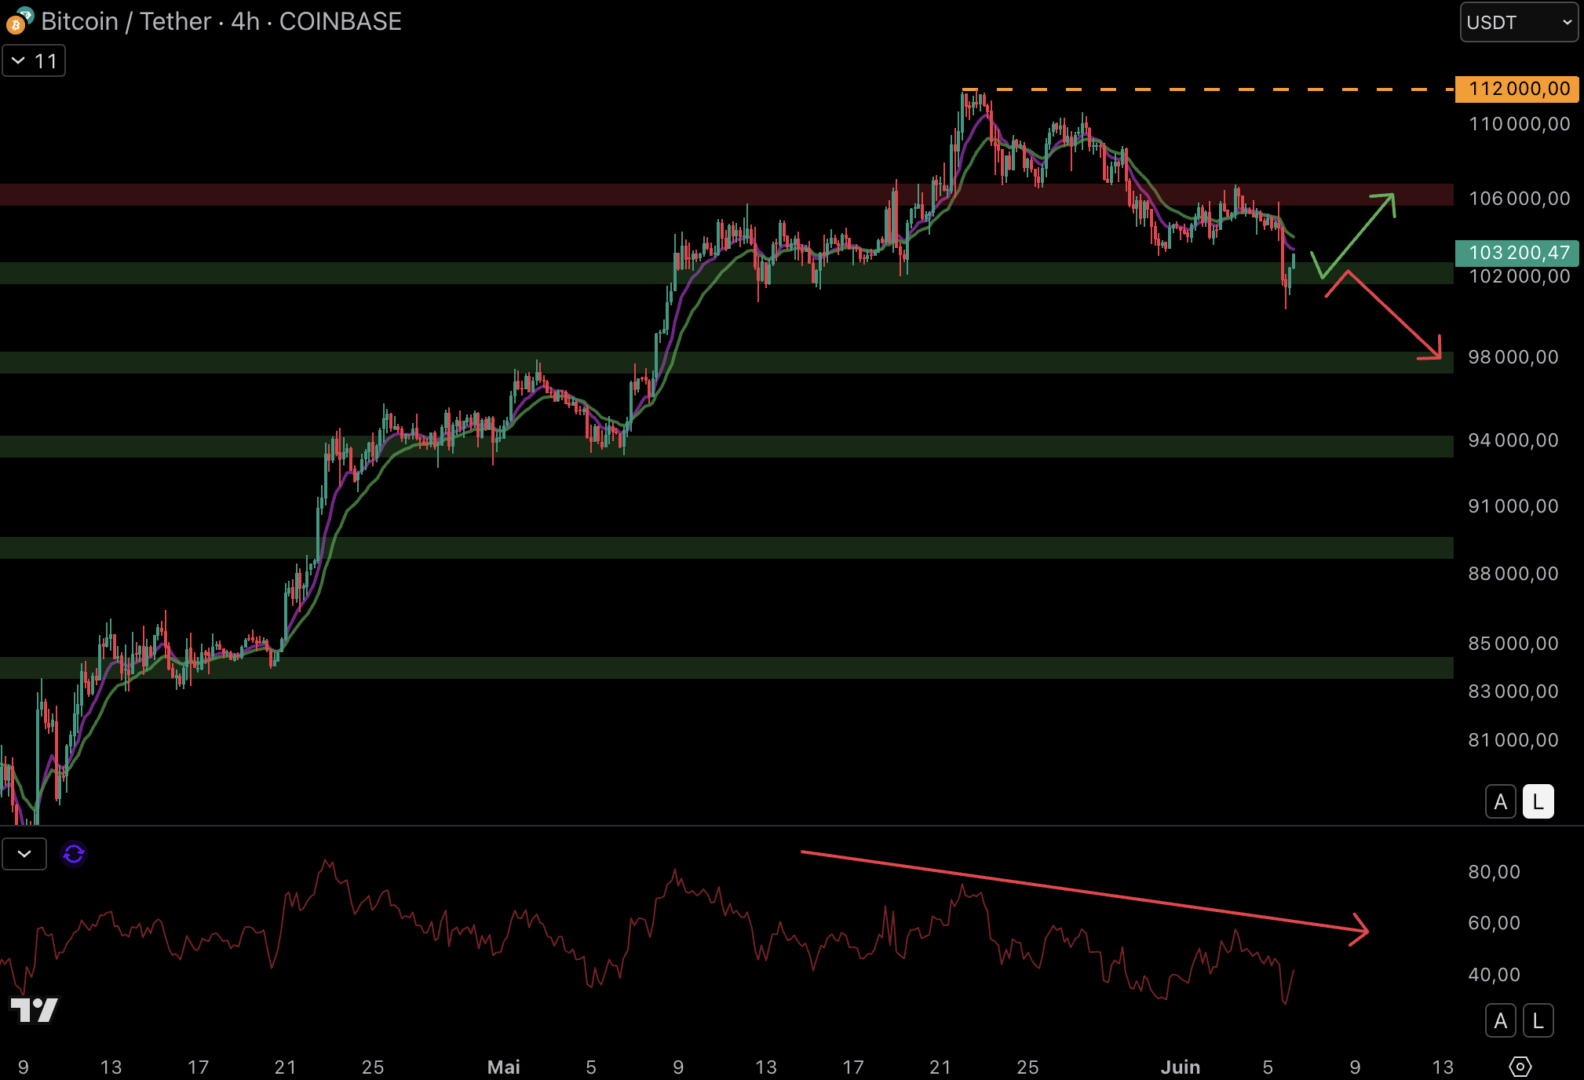
Following the rejection around the Resistance at $ 106,000the price of Bitcoin returned to the Support at $ 102,000. And it looks like the buyers defend this area support:


If the $ 102,000 is kepta return to the Resistance at $ 106,000 is possible. It will then be necessary to break this resistance to hope to find the Summit at $ 112,000. If the BTC falls Under $ 102,000the next level of support is located at $ 98,000. For its part, the RSI develops downwards For several weeks. THE Momentum is therefore bearish In unit of time 4 hours.
The Bitcoin price dropped around $ 100,000 before recovering and reassembled beyond $ 103,000. As long as the course keeps $ 97,000, it has the opportunity to resume its rise in the direction of $ 112,000. If the BTC remains solid in the coming weeks, three altcoins could take advantage of it to speed up to new heights.
