Will the Bitcoin price succeed in recording a new higher historical? The BTC has been stagnating for a few days, and certain elements show that it is necessary to be careful as long as the ATH has not been clearly crossed. Indeed, the offer held by short -term holders is in free fall, and an indicator signals overheating after several weeks of increase. Is the BTC regaining forces before starting up on the rise, or is it forming a new top beyond $ 100,000?
In The Market Check, the objective is to analyze the situation from a technical point of view and thanks to on-chain indicators, in order to determine if the price of Bitcoin is still in good conditions to evolve in Bull Run, or if a Bear Market is close. We start without further delay!
Bitcoin accelerates after having crossed an important on-chain threshold
The graph below presents the evolution of the price of bitcoin and Average purchase price of short -term holders (orange curve). In general, we consider that bitcoin is in Handy conditions When it evolves Beyond the orange curve. In fact, these investors tend to be optimistic as long as their purchases are positive. On the other hand, you must be wary of falls under the price made of short -term holders. In February, the loss of this level on-chain caused lowering volatility and a fall under the $ 80,000.
But thanks to the recent bouncethe situation is again positive For the king of cryptos:
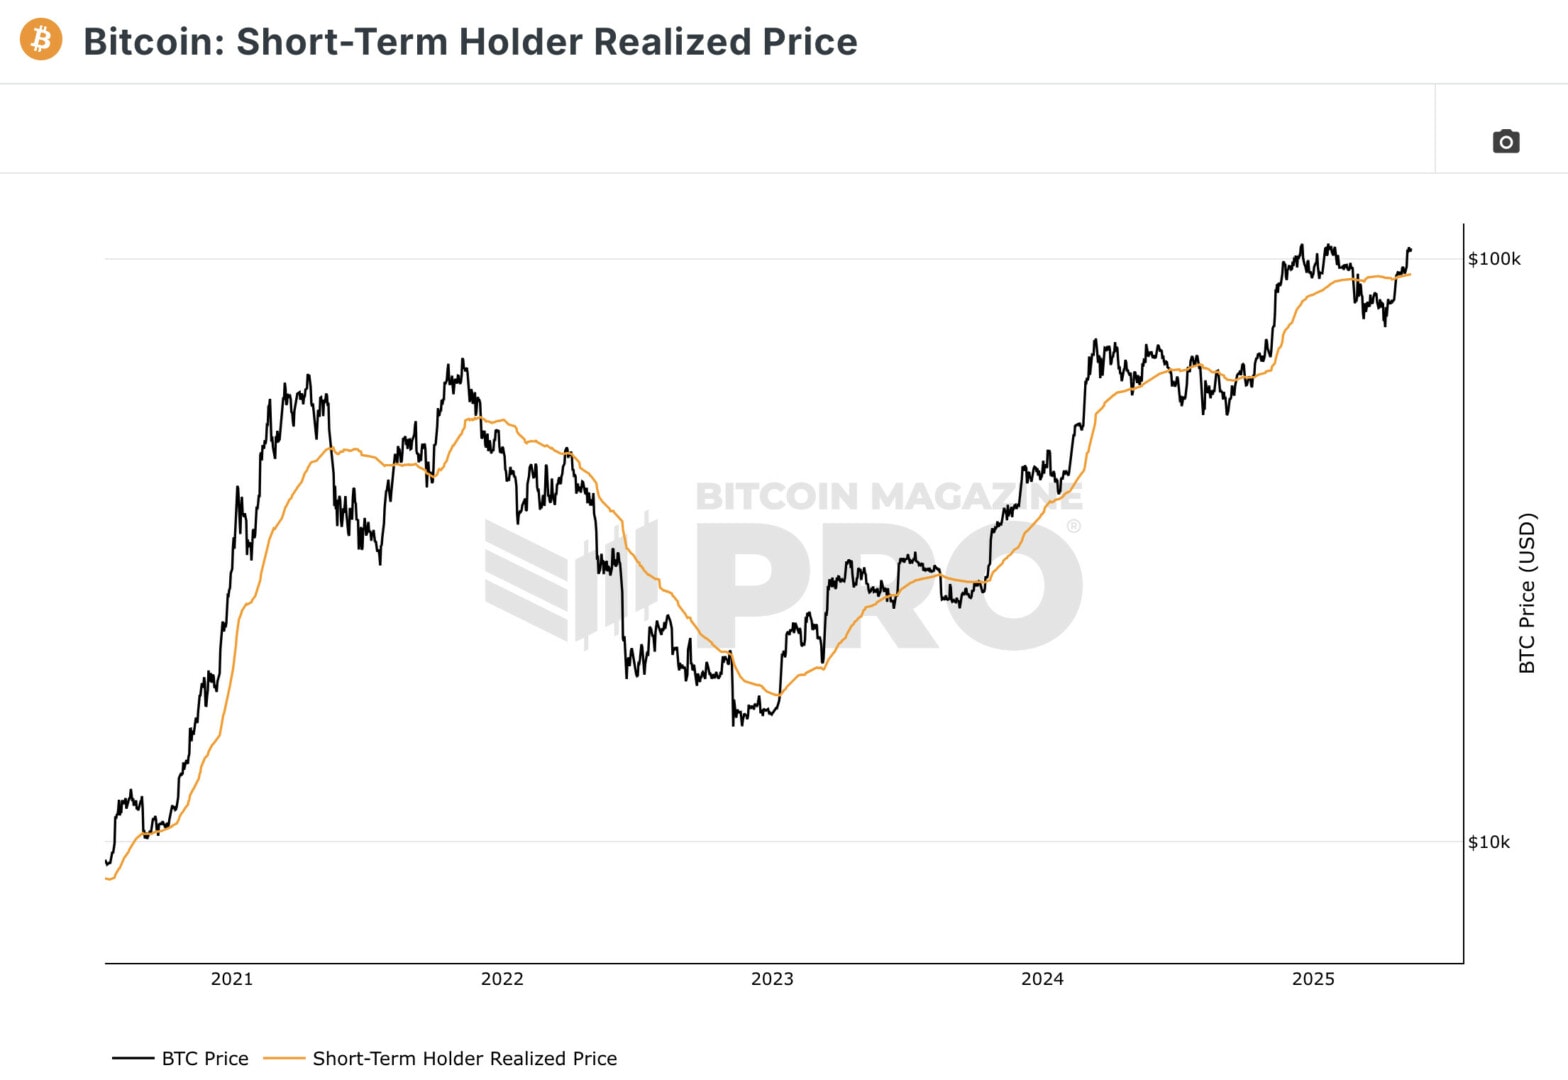

The passage beyond the orange curve led the BTC to the last historical summits. THE Bull Run are characterized by a BTC course that develops Beyond the orange curveas in 2021.
However, This cycle is different from the previous onebecause since 2023, there has been Several falls under the threshold on-chain. And so far, no lowering signal has sent Bitcoin to Bear Market. The different falls were Purchasing opportunitiesand as long as the course keeps the Orange curve at $ 94,000we can hope for a BTC bullish acceleration beyond his last Ath around $ 110,000.
Does Bitcoin set off for a new ATH?
After seeing that the price of bitcoin evolves again above the average purchase price of short-term holders, let’s look at the technical situation thanks to different mobile averages ::
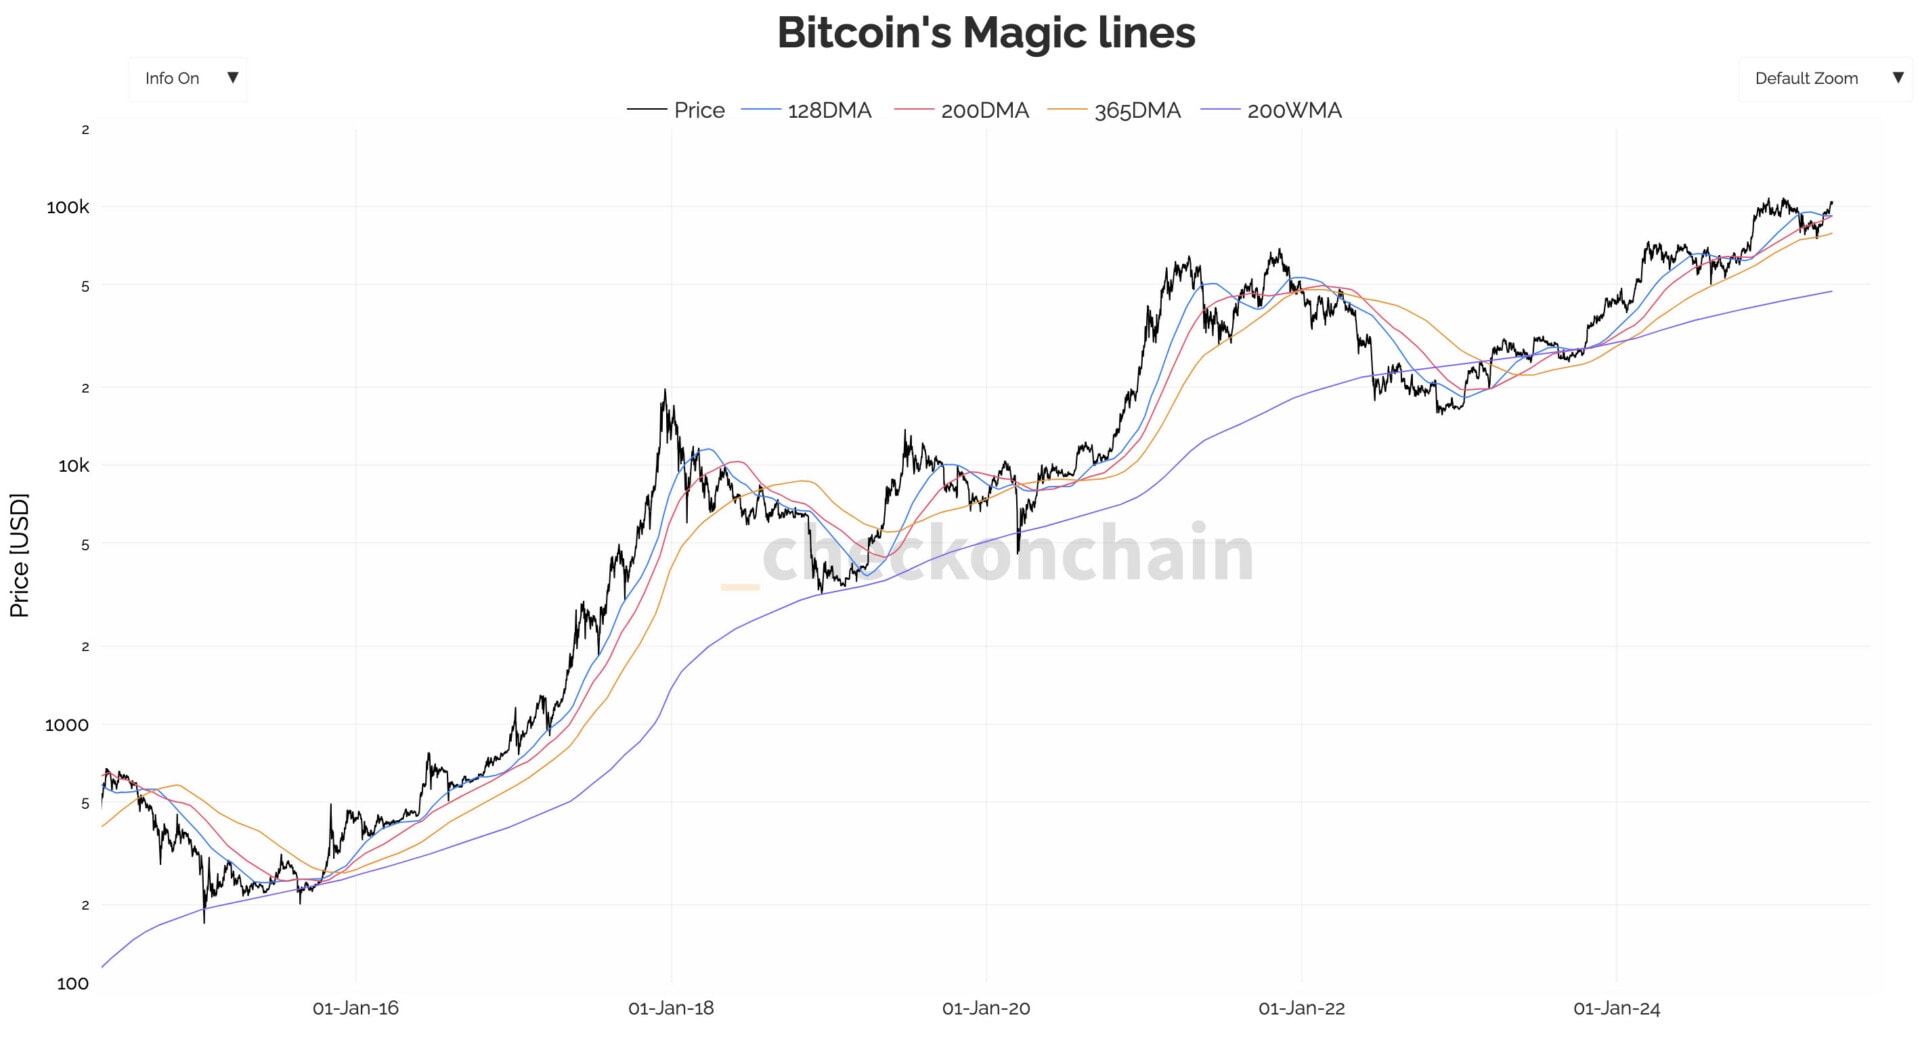

Bitcoin has rebounded at the level of Mobile average over 365 days (orange)and he is back beyond the Middle Mobiles at 200 days (red) and at 128 days (blue). The BTC therefore does not indicate Nothing negative from a technical point of viewand as long as he keeps these mobile averages, he could continue to record new ATH. The data of the graph above show that the situation is for the moment different from the last two Bear Market (2018 and 2022).
Still no extreme euphoria on the cryptocurrency market after the rise in bitcoin
The market feeling indicator Crypto fear and greed index (CFGI) is bounced back following the recent increase in Bitcoin. However, despite the return of the BTC beyond the $ 100,000the indicator still does not point out No extreme euphoria (blue). It continues to evolve in euphoria zone (green) ::
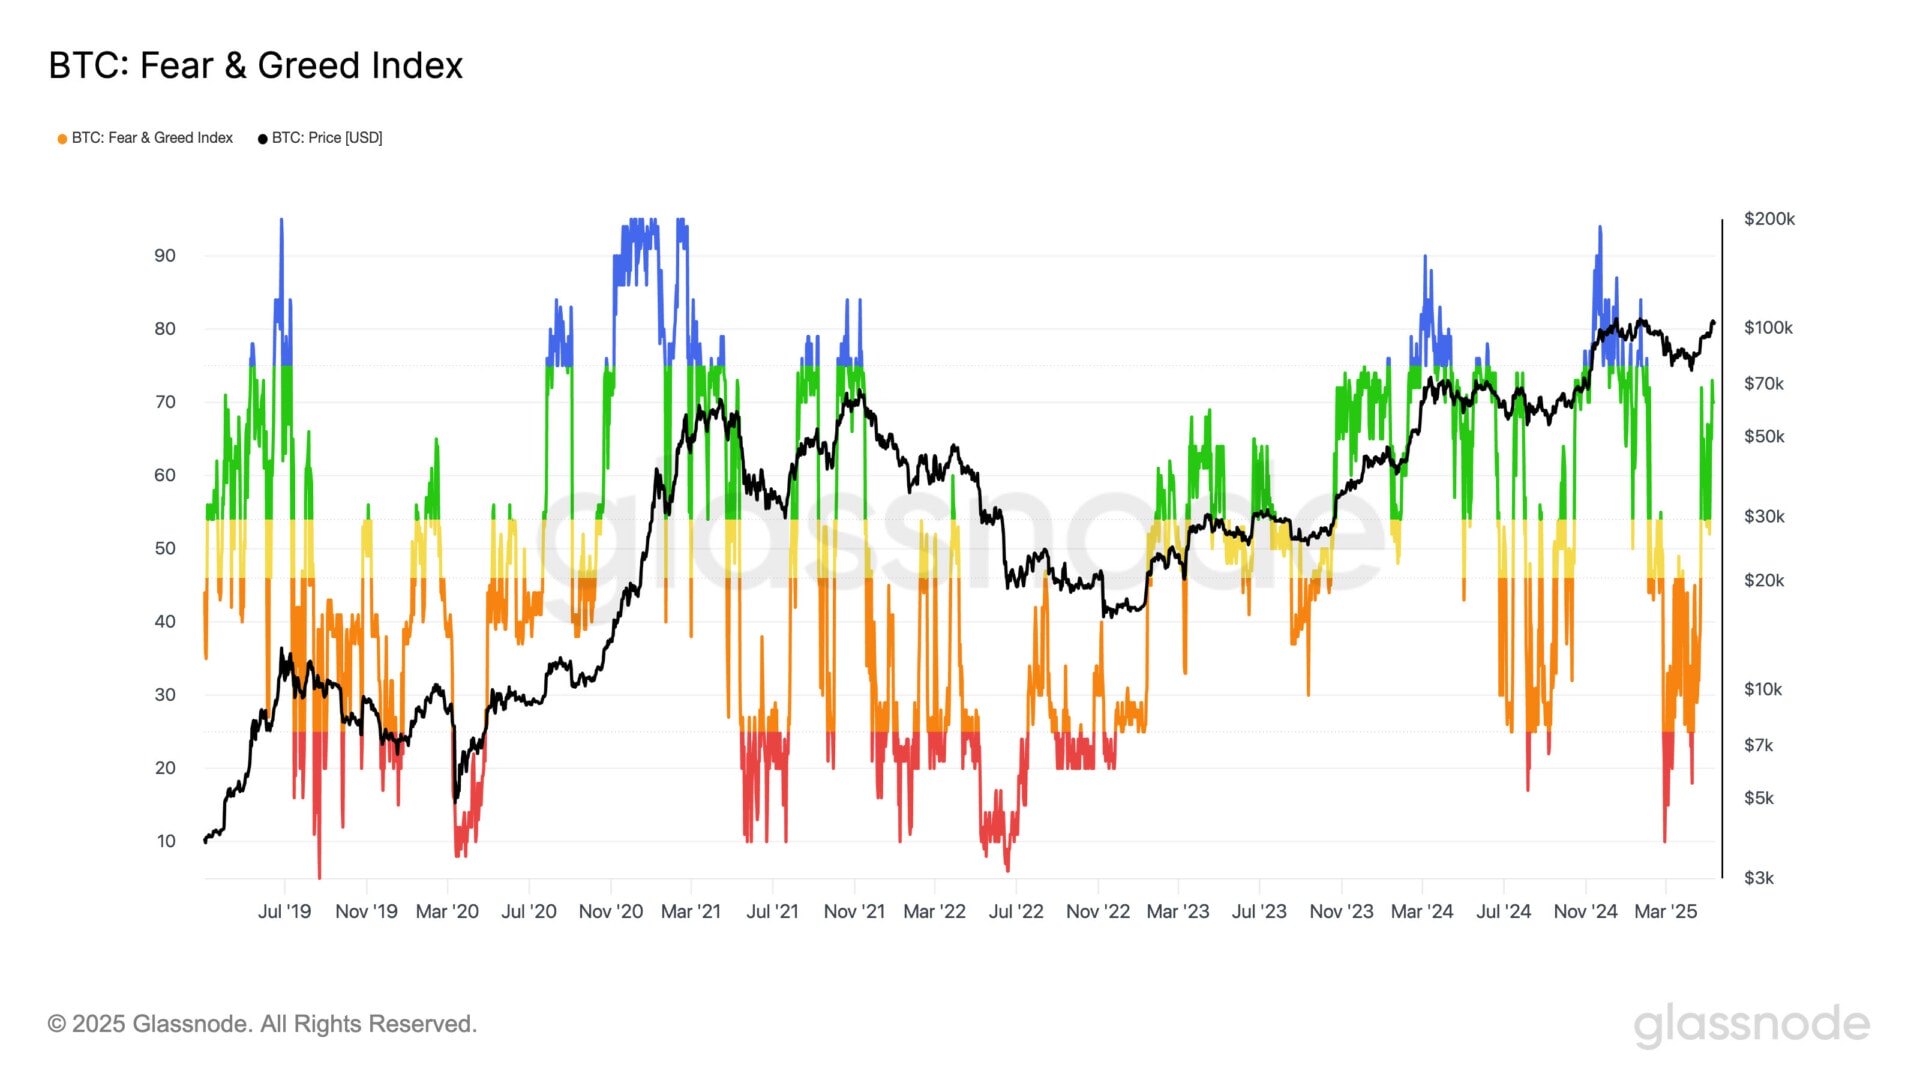

An increase beyond the ATH may well bring the indicator to the blue zone, either by level of excess bruise. Despite everything, the Bull Run’s most volatile periods arrive when the indicator evolves in Green and blue zone. During this cycle, we notice that the feeling evolves very quickly. Indeed, at the beginning of April, the indicator was in the red, in the area ofextreme fear.
The MVRV Momentum sends a Haussier signal
Last week, we mentioned the fact that, despite the rebound, the MVRV Momentum had not sent any Haussier signal. But the situation is now different, because the MVRV Ratio has crossed the mobile average over a year (purple) ::
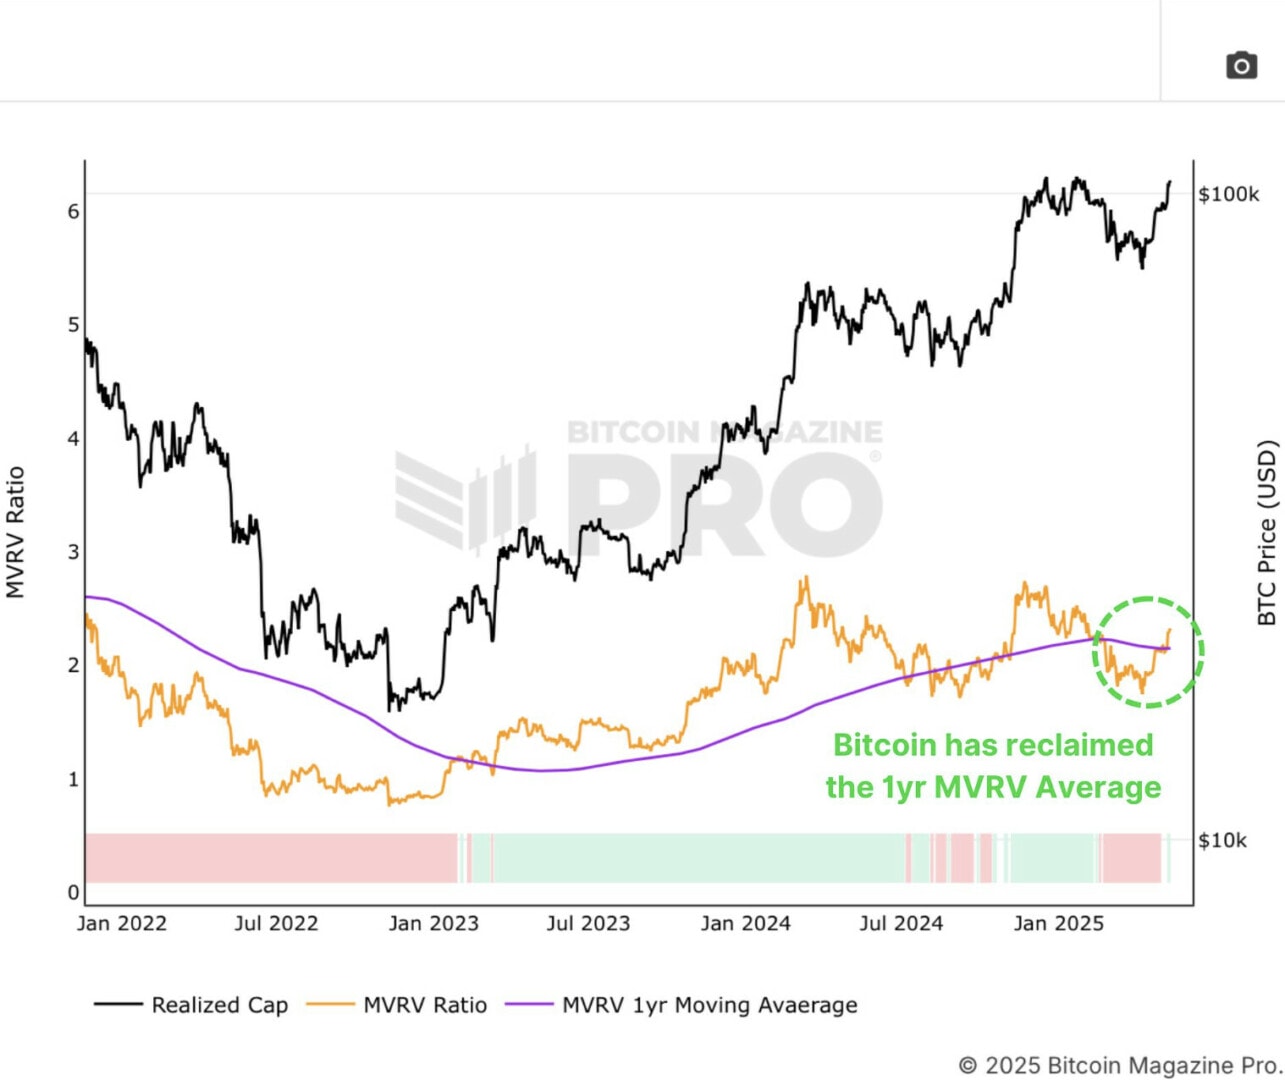

In 2024, the crossing of the mobile average over a year had led to a bullish acceleration with a passage beyond $ 100,000. This time, the BTC could accelerate beyond its previous ATH. But to have a Healthy dynamicas in 2023 for example, the indicator will have to stay beyond the mobile average over a year. Otherwise, there is a risk of going into lowering conditions.
The Pi Cycle Top Indicator has still not sent a top signal on Bitcoin
Different indicators were built in order to find the market topsand the Pi cycle Top Indicator In fact. Of course, the indicator can be wrong, but we observe that it is relatively relevant. This metric has been developed by Philip Swift, and it is made up of two mobile averages ::
- 111 DMAor the mobile average at 111 days (green)
- 350 DMA X2which corresponds to twice the mobile average at 350 days (purple)
When the Mobile average at 111 days exceeds multiple 2 of the mobile average at 350 daysan excess is reported, and a top tends to arrive on the BTC:
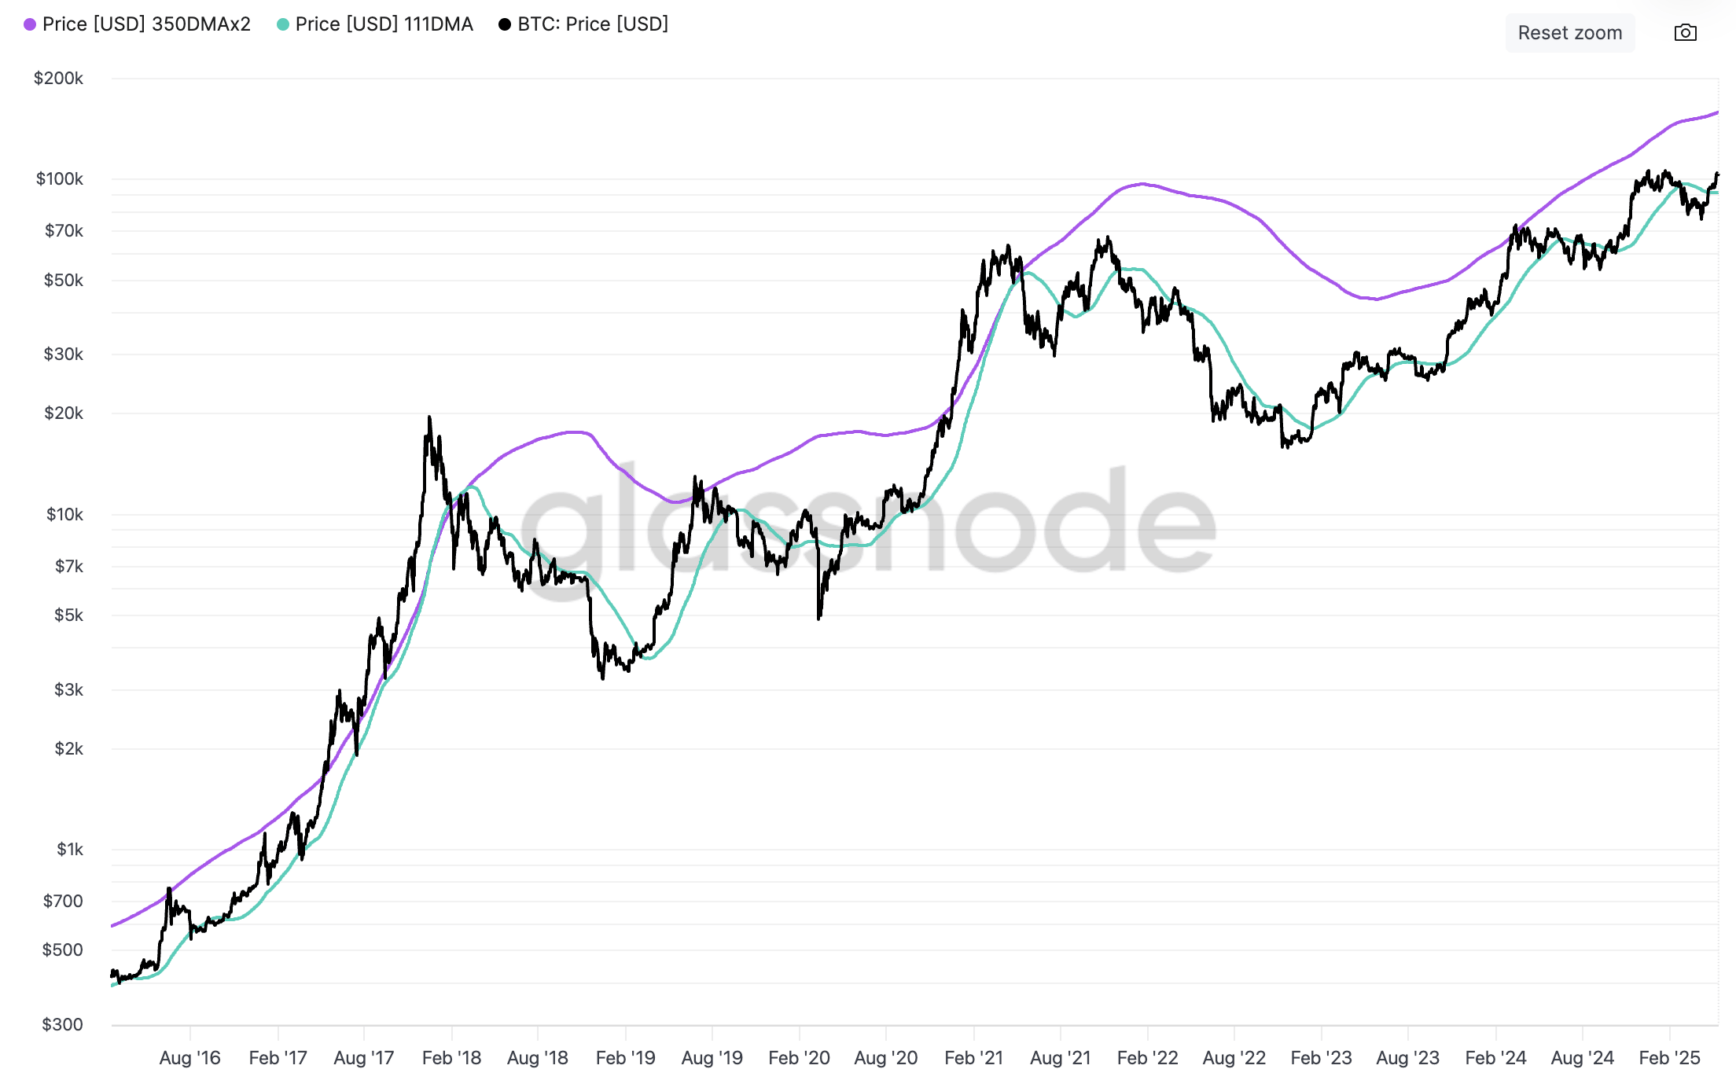

Bitcoin prices recorded a impressive increase from the lowest marketbut the metric still has no top signal. If we base ourselves on this indicator, the price of Bitcoin still has room before being in an excess zone, as in previous Bull Run. Will this indicator once again give the BTC top ? If this is the case in the coming months, you will probably have to be careful.
Key points to remember
The Bitcoin course stagnates just below the last historical summits, and the indicators analyzed today are encouraging. Indeed, Bitcoin evolves clearly beyond the average purchase price of short-term holders, and above the mobile averages at 128 days, 200 days and 365 days. In addition, a bullish signal was observed on the MVRV Momentum and no lower signal appeared on the top Indicator cycle. Bitcoin therefore has the possibility of recording a new ATH, while Ethereum (ETH) rebounds violently towards the weekly resistance at $ 2,900.
